AI class unit 6: Difference between revisions
No edit summary |
No edit summary |
||
| Line 34: | Line 34: | ||
Now this is an example of unsupervised learning where you find structure in terms of lower dimensionality of data. And especially for very high dimensional data, like image data, this is an important technique. So I talk a little bit later in this unit about dimensionality reduction. So in this class we learn about clustering, dimensionality reduction, and we'll apply it to a number of interesting problems. | Now this is an example of unsupervised learning where you find structure in terms of lower dimensionality of data. And especially for very high dimensional data, like image data, this is an important technique. So I talk a little bit later in this unit about dimensionality reduction. So in this class we learn about clustering, dimensionality reduction, and we'll apply it to a number of interesting problems. | ||
== Terminology == | |||
{{#ev:youtubehd|EZEOXNFgu8M}} | |||
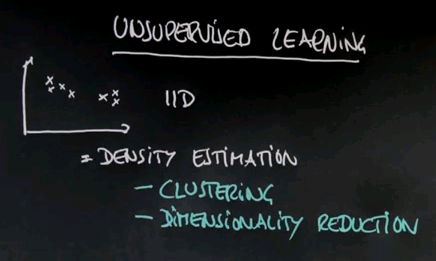
So to start with some lingo about unsupervised learning. If you look at this as a probabilist, you're given data, and we typically assume the data is IID, which means identically distributed and independently drawn from the same distribution. So a good chunk of unsupervised learning seeks to recover the underlying -- the density of the probability distribution that generated the data. It's called density estimation. As we find out our methods for clustering are versions of density estimation using what's called mixture models. Dimensionality reduction is also a method for doing density estimation. And there are many others. | |||
[[File:AI class 2011-11-04-013600.PNG]] | |||
Unsupervised learning can be applied to find structure in data. One of the fascinating ones that I believe exists is called blind signals separation. Suppose you are given a microphone, and two people simultaneously talk, and you record the joint of both of those speakers. Blind source separation or blind signal separation addresses the question of can you recover those two speakers and filter the data into two separate streams, one for each speaker. Now this is a really complicated unsupervised learning task, but is one of the many things that don't require target signals as unsupervised learning yet make for really interesting learning problems. This can be construed as an example of what's called factor analysis where each speaker is a factor in the joint signal that your microphone records. There are many other examples of unsupervised learning. I will show you a few in a second. | |||
Revision as of 00:50, 4 November 2011
These are my notes for unit 6 of the AI class.
Unsupervised Learning
Unsupervised Learning
{{#ev:youtubehd|s4Ou3NRJc-s}}
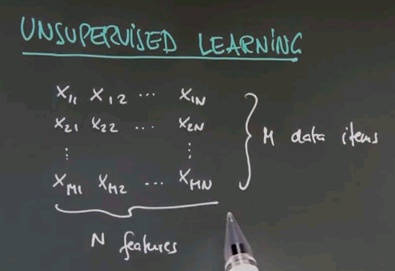
So welcome to the class on unsupervised learning. We talked a lot about supervised learning in which we are given data and target labels. In unsupervised learning we're just given data. So here is a data matrix of data items of n features each. There's m in total.
So the task of unsupervised learning is to find structure in data of this type. To illustrate why this is an interesting problem let me start with a quiz. Suppose we have two feature values. One over here, and one over here, and our data looks as follows. Even though we haven't been told anything in unsupervised learning, I'd like to quiz your intuition on the following two questions: First, is there structure? Or put differently do you think there's something to be learned about data like this, or is it entirely random? And second, to narrow this down, it feels that there are clusters of data the way I do it. So how many clusters can you see? And I give you a could of choices, 1, 2, 3, 4, or none.
{{#ev:youtubehd|kFwsW2VtWWA}}
The answer to the first question is yes, there is structure. Obviously these data seem not to be completely randomly determinate. There seem to be, for me, two clusters. So the correct answer for the second question is 2. There's a cluster over here, and there's a cluster over here. So one of the tasks of unsupervised learning will be to recover the number of clusters, and the centre of these clusters, and the variance of these clusters in data of the type I've just shown you.
Question
{{#ev:youtubehd|GxeyaI9_P4o}}
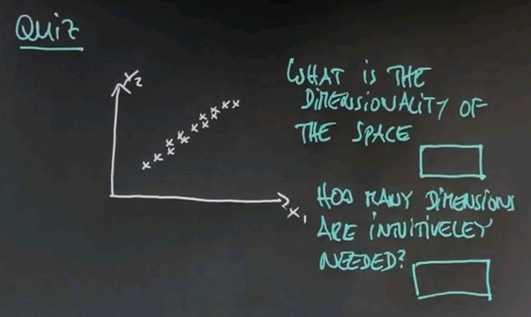
Let me ask you a second quiz. Again, we haven't talked about any details. But I would like to get your intuition on the following question. Suppose in a two-dimensional space all the data lies as follows. This may be reminiscent of the question I asked you for housing prices and square footage. Suppose we have two axes, x1 and x2. I'm going to ask you two questions here. One is what is the dimensionality of this space in which this data falls, and the second one is an intuitive question which is how many dimensions do you need to represent this data to capture the essence. And again, this is not a clear crisp 0 or 1 type question, but give me your best guess. How many dimensions are intuitively needed?
{{#ev:youtubehd|4uj36iX1Pkk}}
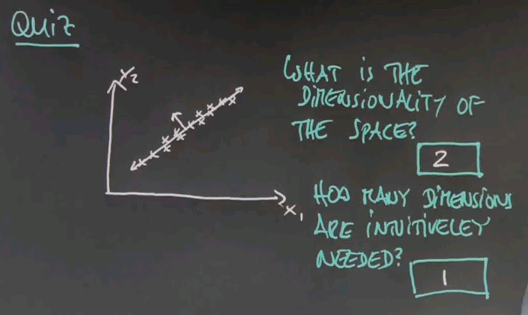
And here are the answers that I would give to these two questions. Obviously the dimensionality of the data is two, there's an x dimension and a y dimension. But I believe you can represent this all in one dimension. If you pick this dimension over here then the major variation of the data goes along this dimension. If you were for example to look at the orthogonal dimension, in this direction over here, you would find that there's very little variation in the second dimension, so if you only graphed your data along one dimension you'd be doing well.
Now this is an example of unsupervised learning where you find structure in terms of lower dimensionality of data. And especially for very high dimensional data, like image data, this is an important technique. So I talk a little bit later in this unit about dimensionality reduction. So in this class we learn about clustering, dimensionality reduction, and we'll apply it to a number of interesting problems.
Terminology
{{#ev:youtubehd|EZEOXNFgu8M}}
So to start with some lingo about unsupervised learning. If you look at this as a probabilist, you're given data, and we typically assume the data is IID, which means identically distributed and independently drawn from the same distribution. So a good chunk of unsupervised learning seeks to recover the underlying -- the density of the probability distribution that generated the data. It's called density estimation. As we find out our methods for clustering are versions of density estimation using what's called mixture models. Dimensionality reduction is also a method for doing density estimation. And there are many others.
Unsupervised learning can be applied to find structure in data. One of the fascinating ones that I believe exists is called blind signals separation. Suppose you are given a microphone, and two people simultaneously talk, and you record the joint of both of those speakers. Blind source separation or blind signal separation addresses the question of can you recover those two speakers and filter the data into two separate streams, one for each speaker. Now this is a really complicated unsupervised learning task, but is one of the many things that don't require target signals as unsupervised learning yet make for really interesting learning problems. This can be construed as an example of what's called factor analysis where each speaker is a factor in the joint signal that your microphone records. There are many other examples of unsupervised learning. I will show you a few in a second.


